|
|
To be able to debug a multi-threaded application effectively, you must be very familiar with the application and how each of the threads synchronize with each other. Doing so will prevent deadlock conditions from occurring while performing a debugging session unless such condition is one of the bugs in the program being analyzed.
To illustrate the use of the features that may be relevant to debugging a multithreaded application, let us recreate session 10 of ``Using the command line interface of debug'' using the graphical interface of debug. The problem in traverse can be detected easily using the command line interface, so this session is not meant so much for the analysis of the program but rather to present some of the features of the graphical interface.
The selection sequence
File --> Windowsmeans to select the File menu button which pops up a set of options among which you select the Windows option. This notation will be used throughout this session.
To get things started, perform the following steps:
Debug --> Createfrom the Source window. Enter traverse /var/lp /var/cron in the ``Command Line'' field of the ``Create'' popup.
File --> Windows --> Processfrom the Source window.

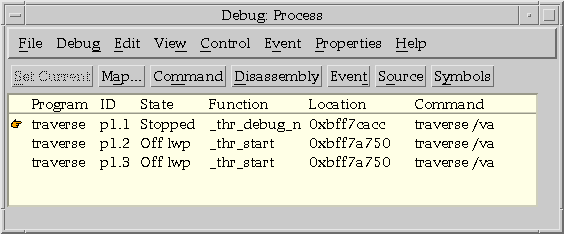
The field that we are interested in is the ``State'' field of the ``Process pane''. This field shows that p1.1 is in a Stopped state while p1.2 and p1.3 are Off lwp. Stopped is a common state that applies to threads and processes. This is acquired through any event that causes the process or thread to stop its execution (for example, a breakpoint or a halt command).
Aside from the other states that apply to processes, a thread can be in a [Core] Off lwp state, or a [Core] Suspended state (where Core appears if you are debugging a multithreaded core image). When threads are multiplexed, they can be scheduled off of a LWP by the threads library or by a call to thr_yield(3thread). In this case, the thread enters the Off lwp state until it picks up an LWP again. A thread, multiplexed or bound, can enter the Suspended state through a thr_suspend(3thread) call. It resumes execution via a thr_continue(3thread) call. While in either of these two states, you cannot issue the run or halt command on a thread. However, you can perform all other operations such as setting breakpoints and setting or displaying variable values.
The application of commands depends on the following conditions:
Some commands are not allowed if more than one object is selected or if the selected objects are in different states. For example, if you select p1.1 and p1.3, and you popup the Control menu, the ``Run'' option is desensitized because p1.3 is in the Off lwp state. In fact, none of the options in the ``Control menu'' are available in this case. If both threads are in the Stopped state, then, the ``Run'' command should be available.
There is a parallelism between debugging a multi-threaded application and debugging multiple processes (see the previous section ``Debugging multiple processes''). Threads can be likened to processes in that they execute on their own and vie for system resources. One difference is that threads belong to a single process and are spawned by that single process as that process executes. These threads share a single address space. Processes are invoked and may not be related to one another. From a debugging perspective, if you need to view multiple threads' stack and symbols simultaneously (as well as process' stacks and symbols), you will need multiple window sets.
A stack trace is helpful in analyzing the execution of individual threads. The graphical debugger provides a convenient way of simultaneously depicting the stack on a per thread basis by allowing you to create a window set for each thread. Continuing where we left off in our current session, you can do this by performing the following steps for each thread:
File --> New Window SetThis creates a separate Source window for p1.2.
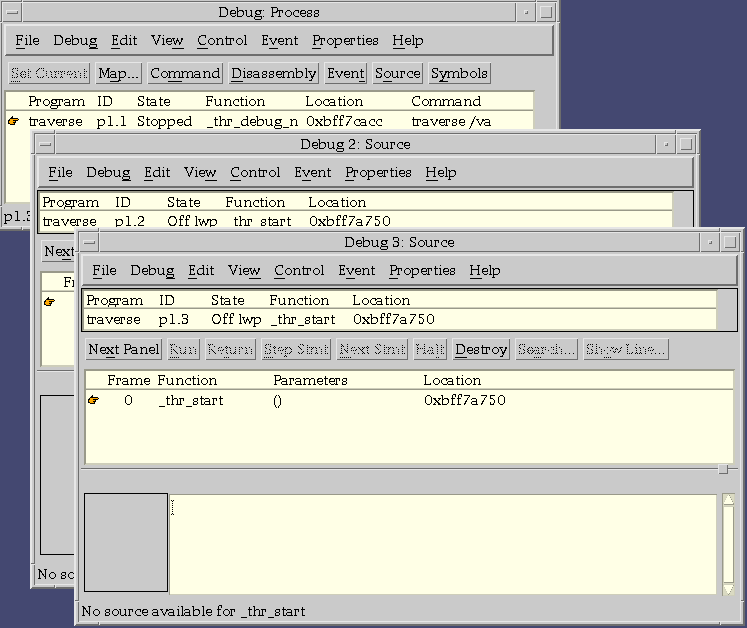
The Debug: Source window is the window set for the thread p1.1,
Debug 2: Source is that for p1.2, and
Debug 3: Source is the window set for p1.3.
The information for each window gets updated when traverse
executes.
The granularity settings (in the ``Granularity'' popup window) specifies the debugger's behavior with respect to the application of commands to programs, processes and threads. These settings dictate whether the commands you issue to debug should apply only to specific threads, processes or the entire program.
When you popup the Granularity window (Properties --> Granularity) you will notice that the default setting for commands that create events applies to the parent program and that for other commands applies to the thread only.
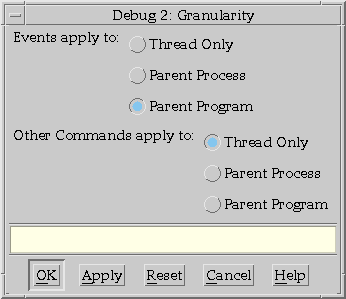
What does this mean to a multithreaded program such as traverse? If you wanted to set a breakpoint at the add_to_list call only for the thread p1.2, you need to reset the granularity setting from Parent Program to Thread Only for the Events apply to: portion. Otherwise, setting such a breakpoint will apply to all the applicable threads in the program even if you had selected p1.2 only.
The effect of the Granularity setting applies to individual window sets. Thus, if you set the event command setting in Debug:Source (the first window set containing p1.1) to apply to threads only, and you set a breakpoint at the add_to_list call from this same window, it will be set in thread p1.1 only. You will not realize this event when you run the program because thread p1.1 does not call this function; it is called only from threads p1.2 and p1.3.
To illustrate:
Properties --> Granularityand change the Events apply to: setting to Thread Only. Then, click on the OK button.
Event --> Stop on FunctionChoose traverse from the Objects: list to display the list of functions. Then, choose the function add_to_list as in the following:
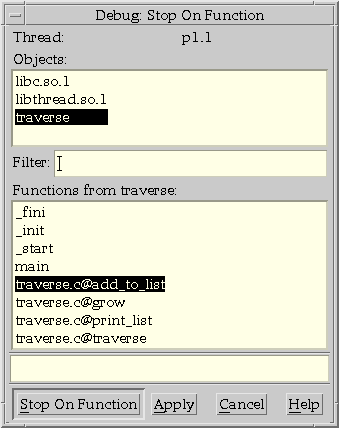
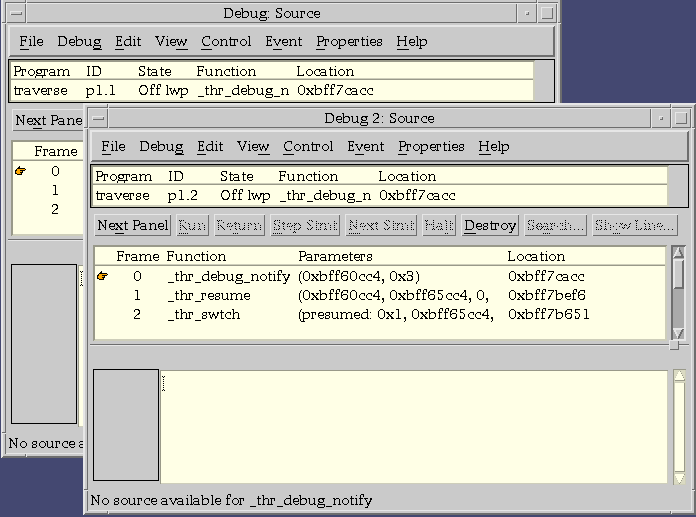
Note that since threads p1.1 and p1.2 are both in the Off lwp, the debugger will not allow you to try to run either one.
By default, whenever a thread changes state the debugger will halt execution of the thread and beep to notify the user of the state change. By changing the debugger's default "thread action", you can let thread state changes (including creation of a new thread) take place without stopping execution. The "thread action" resource may be set at debugger invocation (see ``Invoking the debugger'' and ``Resource settings'') or through the ``Output Action'' popup window while the debugger is running.
Also, if you are interested in debugging only one thread (if, for example, the problem seems to be in the main thread and all other threads do some secondary task), you may release all the other threads by selecting those threads in the Process window and then selecting the Release Running command button. (In the debugger's default configuration Release Running is in the ``Release'' submenu under the ``Debug menu''.) Releasing the threads will cause the debugger to effectively ignore them and you can debug the remaining thread as if it were a single process. However, be aware that this is probably not useful if the bug you are tracking has to do with any interactions between the threads.