Learning to use the graphical debugger
The following section provides a tutorial for some of the
more commonly used debugger features.
It is based on the default configuration of the debugger, which consists
of six windows: the Command, Disassembly, Event, Process, Source and
Symbols windows.
The program being debugged is a simple macro processor that reads from
standard input and writes to standard output.
Macros may be defined in the input stream or on the command line.
This program is one of several used in similar tutorial sessions
for the debugger's command line interface.
See
``Using the command line interface of debug''
for more details.
Please read the following sections in sequential order.
A glimpse at the program macros
The source files making up the program
are found in /usr/ccs/lib/tutorial.
You may use those files to follow this session on your own terminal.
-
Copy Main.c, Macro.c, Macro.h, and test1
from /usr/ccs/lib/tutorial into your home directory.
-
Compile macros:
cc -g -o macros Macro.c Main.c
The screen displays the following:
   Macro.c
   Main.c
-
Try running the program:
macros -DMAC=123 <test1 >result
Warning, X redefined
-
Look at the output with the cat command:
cat result
This is what you should have seen:
this is a test

this is a test test this is a test

x
 1 2 3 4
123
Instead, this is what you will see:
this is a test

this is a test test this is a test

x
 A1
123
The problem is that the macro A1 is not being expanded.
The steps below describe how to find the source of this bug
with the graphical debugger.
The following debugging session focuses on the analysis of the
lookup and insert functions defined in macro.c.
The debugging session
Given the background on the program macros and its problems,
you are now ready to try the graphical debugger.
1. Starting the graphical Debugger
Make sure that you are sitting in front of an xterm window,
running the CDE desktop.
Access the debugger in one of the following
three ways:
-
If you are already in the desktop,
click on the Debug icon
from the Desktop_tools folder of the Application Manager.
-
If you are at the shell prompt in an xterm window,
type debug from the Command Line.
-
If you have the File Manager on your desktop, click the right
mouse button on the program you wish to debug, and select Debug from the
popup menu.
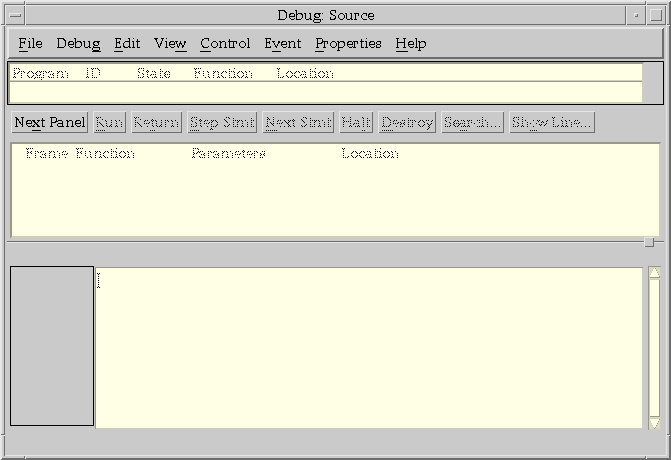
For both of these methods, the Source window is displayed:

2. Choosing the program to debug
The
``Create''
command is used to get a program ready to run
under the control of the debugger.
This command is found under the
``Debug menu''
of the Source window.
NOTE:
Throughout this tutorial session,
placement of options is based on the default configuration.
You may change the placement of any button,
as well as the layout of the panes in the windows.
See
``Configuration''
for details.
-
Select Debug and the Debug menu popup is displayed.
-
Select Create from the Debug menu popup and the
``Create''
window appears.
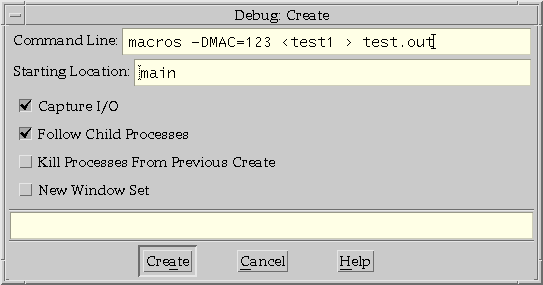
Type in the name of a program that you wish to debug in the
``Command Line'' field.
Since you want to debug the program macros in this session,
enter:
macros -DMAC=123 <test1 >test.out
This is how the Create window should look like at this point:

-
Click on the Create button or press
<Return.>
NOTE:
To activate a selection from most of the popups, you can
either click on the desired button or press the
<Return>
key.
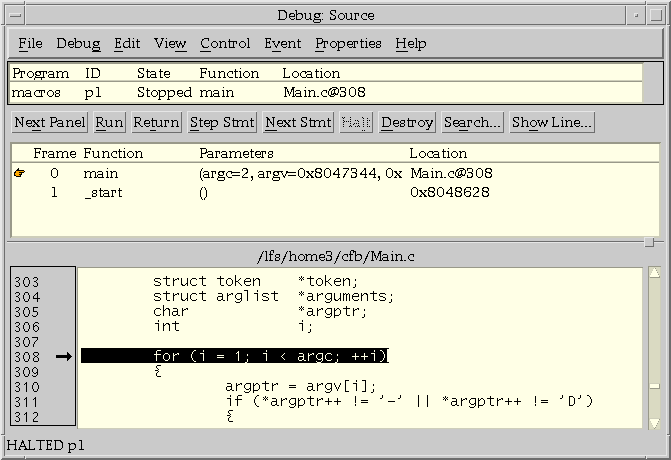
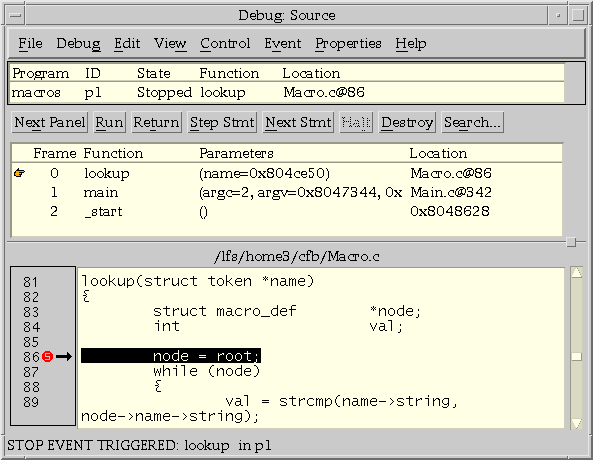
The Source window now displays the following:

The
``Status pane''
on the top section of the window
shows the current process.
The
``Stack pane''
in the middle shows the stack trace
for the current process,
with a pointer next to the current frame.
The
``Source pane''
at the bottom shows the source for
the current function in the current process.
These panes will be updated as the tutorial
continues.
3. Creating events
lookup is the function that looks for macro definitions.
Check to see if lookup is being called for A1 by
setting a breakpoint (a type of ``stop event'') on lookup.
The commands that create events are all found in the
``Event menu''.
-
Select Event from the menus at the top of the Source window.
-
When the event menu popup appears, select
``Stop on Function''.
This will bring up a popup window displaying a list that contains
the name of the executable file and all the shared objects making
up your program; in this case the list contains simply
libc.so.1 and macros.
-
Click SELECT on macros.
That will make the debugger display in the lower half of the popup window
a list of all the functions defined in the macros executable.
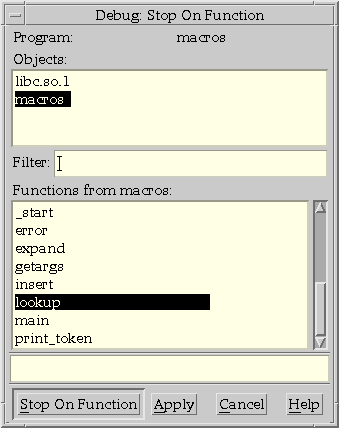
Scroll through the list until you find lookup as shown in the following
popup:

-
Select lookup.
Click on Stop on Function or press
<Return.>
For a shortcut, simply double-click the lookup
item.
You have now created a stop event at every call to lookup.
NOTE:
Breakpoints may be created with the
``Stop on Function''
and
``Set Breakpoint''
options.
You may also set breakpoints by clicking the SELECT button
in the left margin of a line in the
``Source pane''.
Watchpoints may be created with the
``Set Watchpoint''
option in
the Symbols window.
Breakpoints and watchpoints are specialized forms of stop events;
more powerful stop events may be created with the
``Stop''
popup window.
See
``Stop expression''
for a complete description of the different
types of stop events.
4. Running the program
The
``Run''
command allows you to start the execution of the program
being debugged.
You can access this command from the button bar of the Source
window (or from the
``Control menu''
in any window).
To use this command,
select Run from the button bar at the top of the Source
window.
The debugger will let the process run until it hits the breakpoint
on lookup.
When that happens, the source window will look like this:

The Source pane now shows the source for the new current function.
Note how the pointing finger is next to lookup in the Stack pane.
5. Examining symbols
The program has reached the stop event in lookup.
Check to see what it is looking
for by displaying what name points to using the
``Show Value''
popup.
Show Value makes it easy for you to dereference a pointer.
-
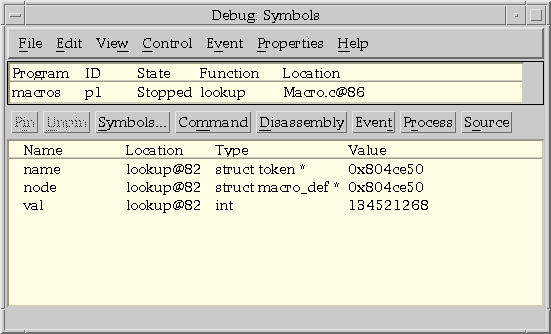
First bring up the Symbols window.
The Symbols window displays values of variables visible from the current context.
The information displayed for each variable includes its location and type.
-
Select Next Panel in the button bar at the top of the Source window.
This will display another set of buttons which are commands to
bring up each of the other debugger windows.
-
Select Symbols in the button bar to bring up the Symbols window.

-
Double-click on name from the
``Symbol pane''
in the Symbols
window to bring up the
``Show Value''
popup window.
NOTE:
This is not the most efficient way to bring up the Show Value
dialog from the Source window,
but was chosen to illustrate the use of the Symbols window.
You could also bring up Show Value by
-
Double-clicking on ``name'' in the text in the Source window,
followed by clicking MENU to bring up the Source pane's popup menu,
and then selecting Show Value in the popup menu, or
-
Clicking SELECT on name in the
``Symbol pane''
and
then selecting the Show Value button in the
``View menu''.
-
The Show Value window will be initialized with the selected variable,
and the Result area will show its value.
Since name is a pointer, the value will be displayed
as a hexadecimal address.
-
To see what name points to,
select the Expand button in the Show Value window.
Since name is a pointer to a structure,
the debugger will display all of the members of the structure.

-
Close the Show Value window by clicking SELECT on the Close button.
6. Associating commands with events
The program may have to call lookup several times before macros
calls it with A1.
Checking what name points to every time the program stops at lookup
could get tedious.
You can tell debug to automatically print what name points to
whenever the stop event triggers.
You can also create a debugger variable to track the number of times
lookup is called.
Here is how you would do it.
-
Select View in the Source window's Menu bar and
the
``View menu''
popup is displayed.
-
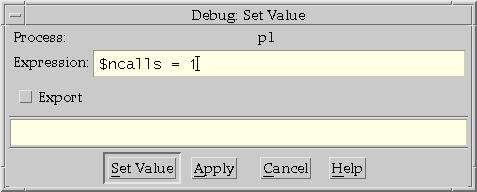
Select Set Value and
the
``Set value''
popup is displayed.
Type the following in the ``Expression'' field of the window:
$ncalls = 1

-
Press
<Return>
or click on the Set Value button.
-
Select Event in the Menu bar.
Select On Stop from the
``Event menu''.
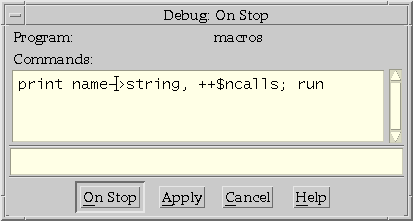
Type the following in the Commands screen of the
``On Stop''
popup:
print name->string, ++$ncalls; run
NOTE:
See
debug(1)
for debugger commands.

-
Click on the On Stop button.
The command sequence will be executed whenever the process
stops, allowing you to see how many times lookup is
called before it reaches A1.
-
Select Next Panel again in the button bar in the Source window
to bring back the original set of command buttons.
-
Select Run from the button bar to run the
program again.
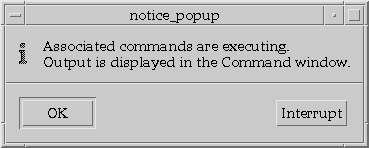
The following notice will appear:

Click on OK to continue.
All the panes in the Source Window will be blanked out,
indicating that the process has exited.
-
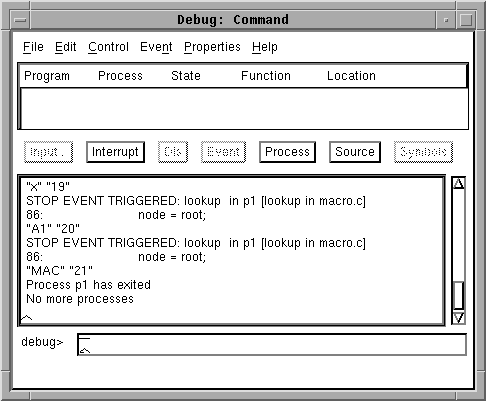
Bring up the Command window to see the output of the Onstop event.
Access this window as follows:
-
Select the File button.
-
Select Windows from the popup.
-
Drag the mouse over to the submenu and select
Command.
NOTE:
You could also access the Command Window by clicking SELECT
on Next Panel in the Button Bar,
followed by clicking SELECT on Command.
The
``Windows''
submenu is simply an alternative
way to bring up any of the debugger's windows.
The Command Window shows you that lookup
was called for A1 on the twentieth call.

7. Repeating the debugging session
Take a closer look at what is going on in lookup.
Start up the program again and run it until lookup is called with
A1:
-
Click on the Source window and select Debug.
The
``Debug menu''
popup is displayed.
Select Create and you get the following:

-
The ``Command Line'' field still has the text
to invoke the program macros
so all you have to do to recreate the program is
click on the Create button.
The Source window will now show you the new
program macros (process p2),
stopped at the first statement in main.
8. Removing events
The events that you created the first time through are still there.
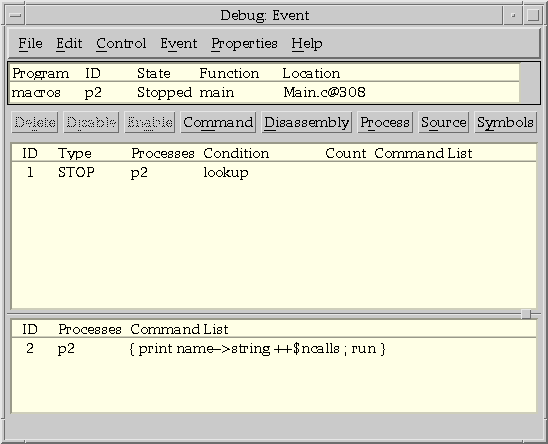
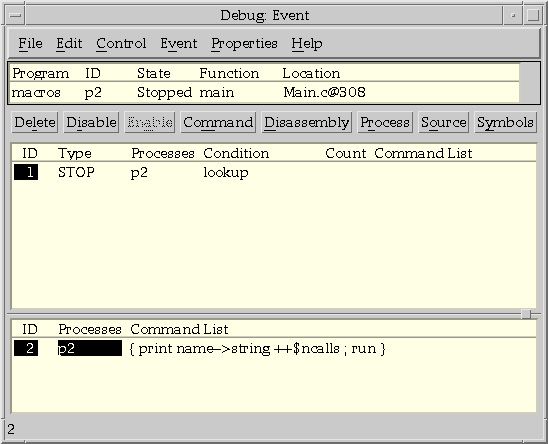
Check the events in the Event window.
Access this window as follows:
-
Select the File button and
select Windows from the popup.
-
Drag the mouse over to the submenu and select
Event.
The Event Window displays the following:

You don't need those events this time so delete them.
Select the events in each pane
(by clicking on any column) as shown in the following window:

-
Select Delete from the button bar in the Event window.
9. Creating an event on the nth call
Rather than creating a stop event on every call to lookup,
you can request the debugger to create one on the nth
call.
Since the search was on the twentieth call to lookup,
create a stop event that takes you there directly.
-
Click on the Source window.
(You can also do this from the Event window.)
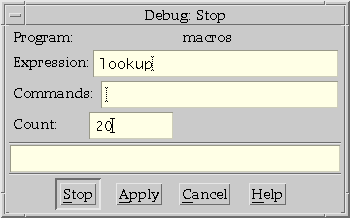
Select Stop in the
``Event menu''.
-
Type lookup in the
``Expression'' field and 20 in the ``Count'' field of the
``Stop''
window to create
a stop event.

-
Click on the Stop button.
-
Click Run from the button bar in the Source window
to run the program again.
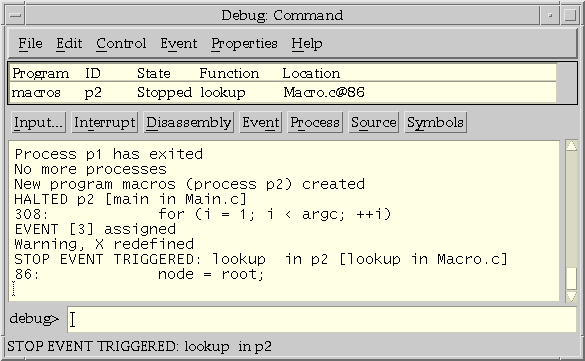
The Command window comes up automatically to display the
program's output:

Note the warning message that X has been redefined.
-
Make sure this is really the right call.
Select View in the Source Window's Menu bar.
The
``View menu''
is displayed.
-
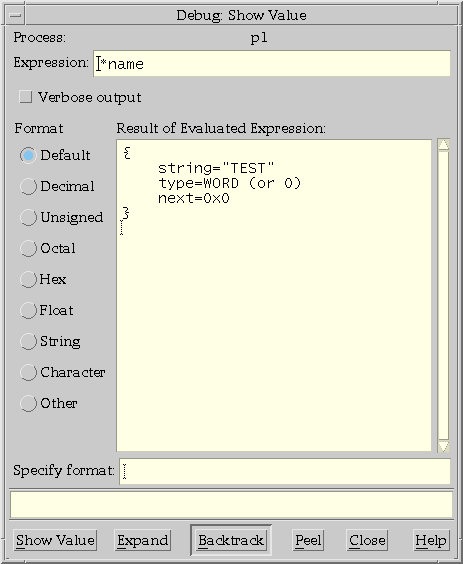
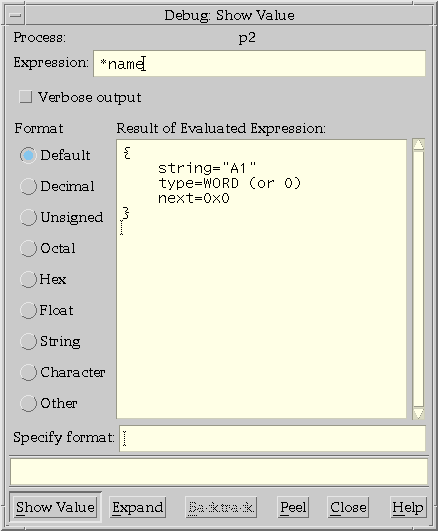
Select Show Value and
type *name in the ``Expression'' field of the
``Show Value''
window.
Then, click on the Show Value button.
The window displays the following:

10. Stepping through the program
lookup maintains a binary tree of nodes that point to macro definitions.
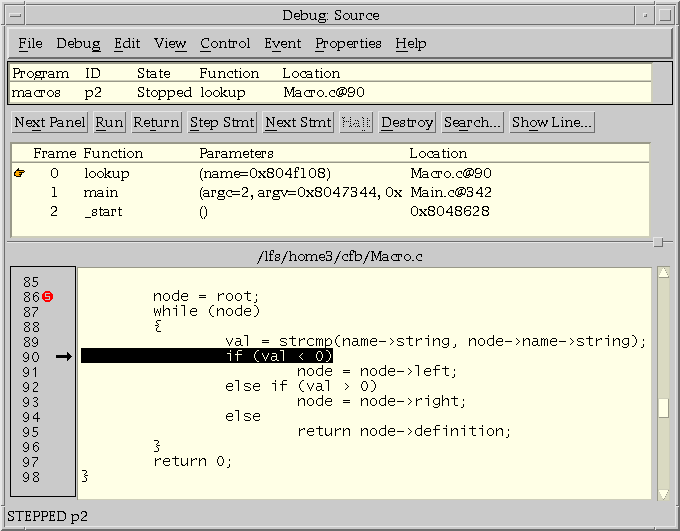
Step through lookup
until you see whether or not lookup can find A1.
Stepping through a program means executing the program
one or several statements or instructions at a time.
Here's how you do this:
-
Select
``Step Statement''
from the Source Window's
button bar until the program reaches line 90.
This will take four steps and the Source window will look like this:

-
Now look at the value of val in the Symbols window.
It will be -1 (the value returned by
strcmp(3C)).
A return value of -1 means that the first string comes before the second string
alphabetically, so the definition of A1 should be in the left branch of the tree.
-
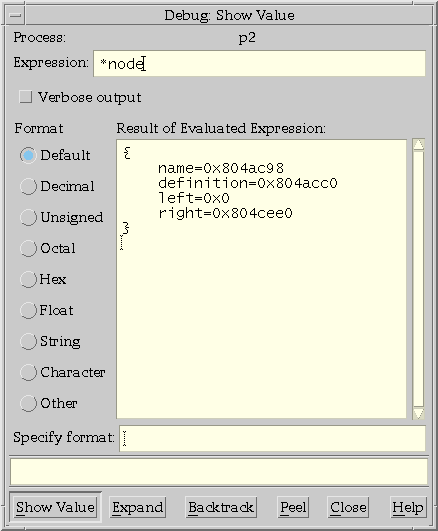
However, if you look at the value of node,
you will see that node->left is zero.
Check the value of node by
typing *node in the ``Expression'' field in the
``Show Value''
window.
Then, click on the Show Value button.
The window displays the
result:

-
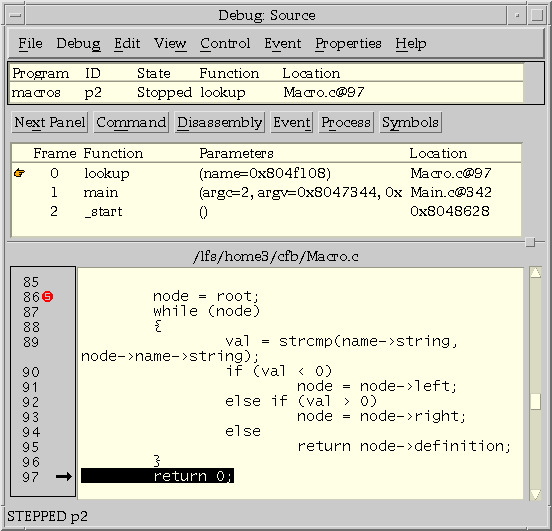
If you let the program go a little further, you will see that the left branch is empty.
It stops looking and returns ``0'', which means that it couldn't find A1.
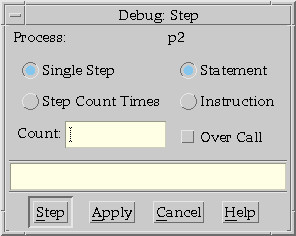
Step through the program again by selecting
``Step''
from the
``Control menu'':

Step three times by selecting Step Count Times and entering 3 in the count line.
-
The Source window
now shows the following changes:

-
Since A1 is not in the binary tree, the problem is apparently further
back in insert, when it was building the tree, so you will have to start over again.
11. Analyzing insert
Re-create macros by clicking on Debug in the Source window
and selecting
``Create''
from the
``Debug menu''.
-
Click on the Kill Processes From Previous Create to enable the option.
Then, click on the Create button.
-
Delete the stop
event on lookup:
select File and Windows to
select the Event window as you did previously.
-
Highlight the following line in the Event window:
3 STOP p3 lookup 20
Select Delete in the button bar to delete
the stop event.
-
Add a new stop event on the fifth call to insert.
(A1 is the fifth macro definition):
select Stop from the
``Event menu''.
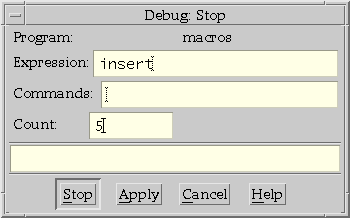
Type insert in the ``Expression'' field and 5
in the ``Count'' field:

-
Click on the Stop button or press
<Return>
to create the event.
-
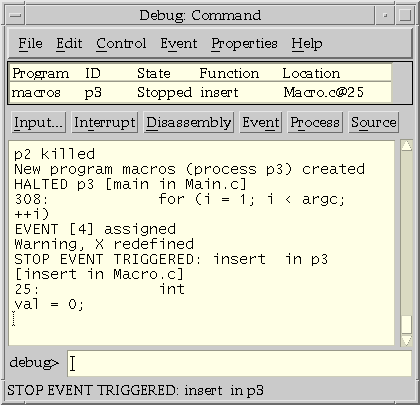
Run the program as you did previously.
The Command window automatically pops up.
The Transcript area of the Command pane displays the command and the result:

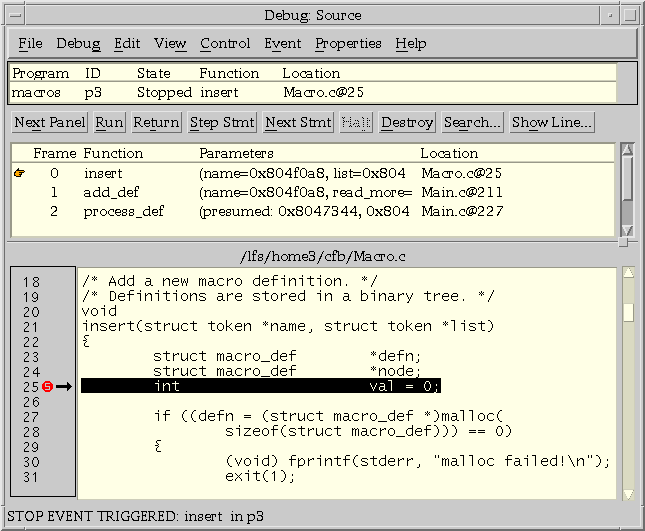
The Source window will reflect the change.
Note how the pointing finger is next to insert:

-
Make sure it is in the right call by typing name->string
in the ``Expression'' field in the
``Show Value''
window.
``"A1"'' is displayed in the ``Result of Evaluation Expression'' area
of the Show Value window.
Close the window by clicking SELECT on the Close button.
-
Scroll through the source for insert in the Source window.
You will see that nothing happens to the tree until it gets into the for loop.
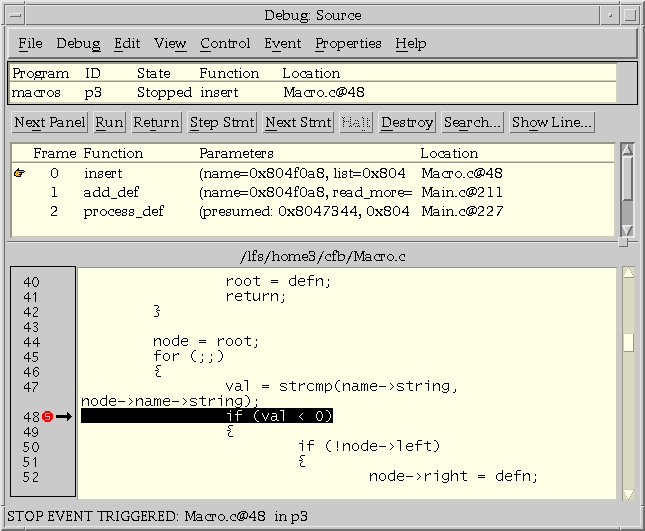
Set a breakpoint at line 48 (after the call to
strcmp(3C))
by clicking on the line number in the left margin.
Then run the program by choosing the Run option
in the button bar.
The Source window reflects the change:

-
The value returned by strcmp should be -1,
and it should go off down the left branch,
just as in lookup.
-
The Symbols window now shows that val is equal to -1.
If you step twice more you will see that the program is making the
assignment to the right branch, which explains why
it couldn't find A1 later by looking down the left branch.
12. Exiting the debugger
Select
``Exit''
in the
``File menu''
to exit the debugger.
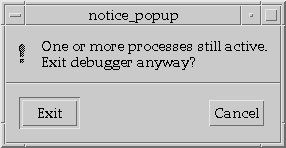
The following popup is displayed:

Click on the Exit button to quit the debugger.
Next topic:
Exploring the debugger's panes
Previous topic:
Invoking the debugger
© 2004 The SCO Group, Inc. All rights reserved.
UnixWare 7 Release 7.1.4 - 27 April 2004
